With the Sandy Point marina entrance needing dredging tides are extremely important to consider when launching your boat or attempting to leave the Sandy Point Marina.
Please note, these charts like any tide forecasts are only estimates. Actual tides may vary significantly due to other weather and atmospheric conditions.
Here are some useful tide charts from NOAA to help when planning for high tide situations
Here are some useful tide charts from NOAA to help with navigating the marina entrance.
- NOAA charts for the Sandy Point Marina entrance with < 6ft tides shown in red.
- NOAA charts for the Sandy Point Marina entrance with < 3ft tides shown in red.
- NOAA charts for the Sandy Point Marina entrance with < 2ft tides shown in red.
- NOAA charts for the Sandy Point Marina entrance with < 1.5ft tides shown in red.
- NOAA charts for the Sandy Point Marina entrance with < 0 ft tides shown in red.
Actual versus predicted tides:
This page shows the actual recorded water levels at the Cherry Point tide station.
July 5th 2020
April 21st 2018
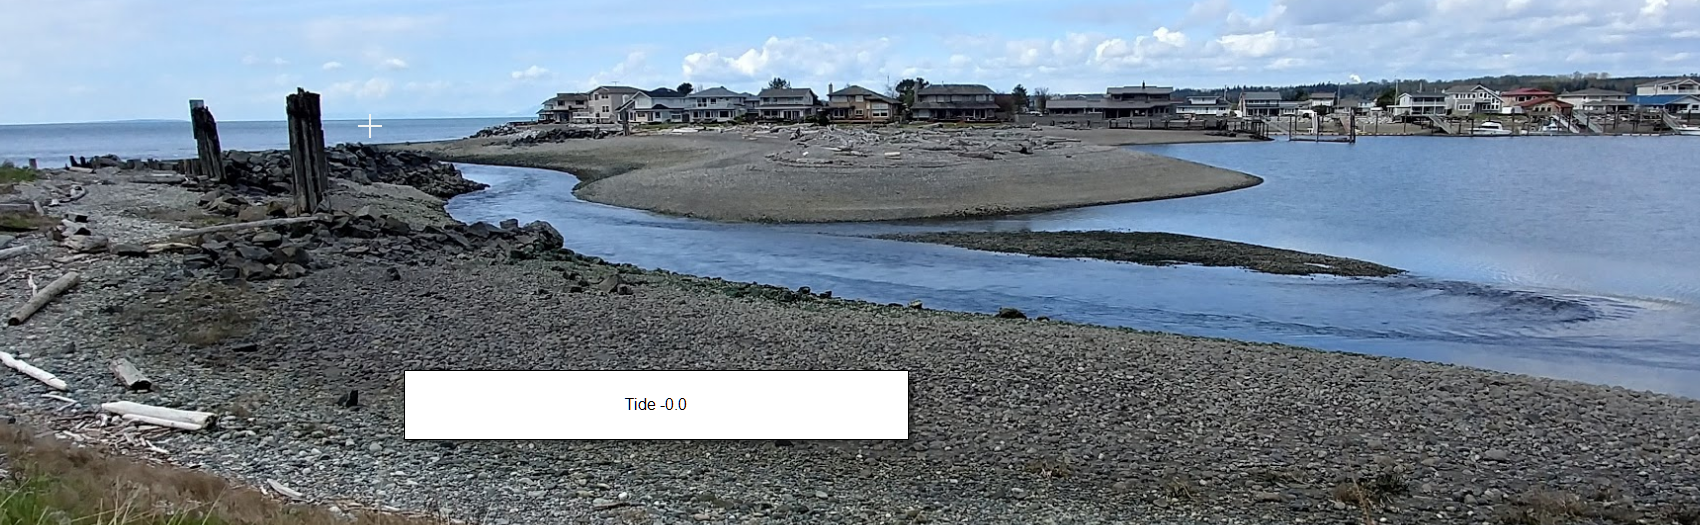
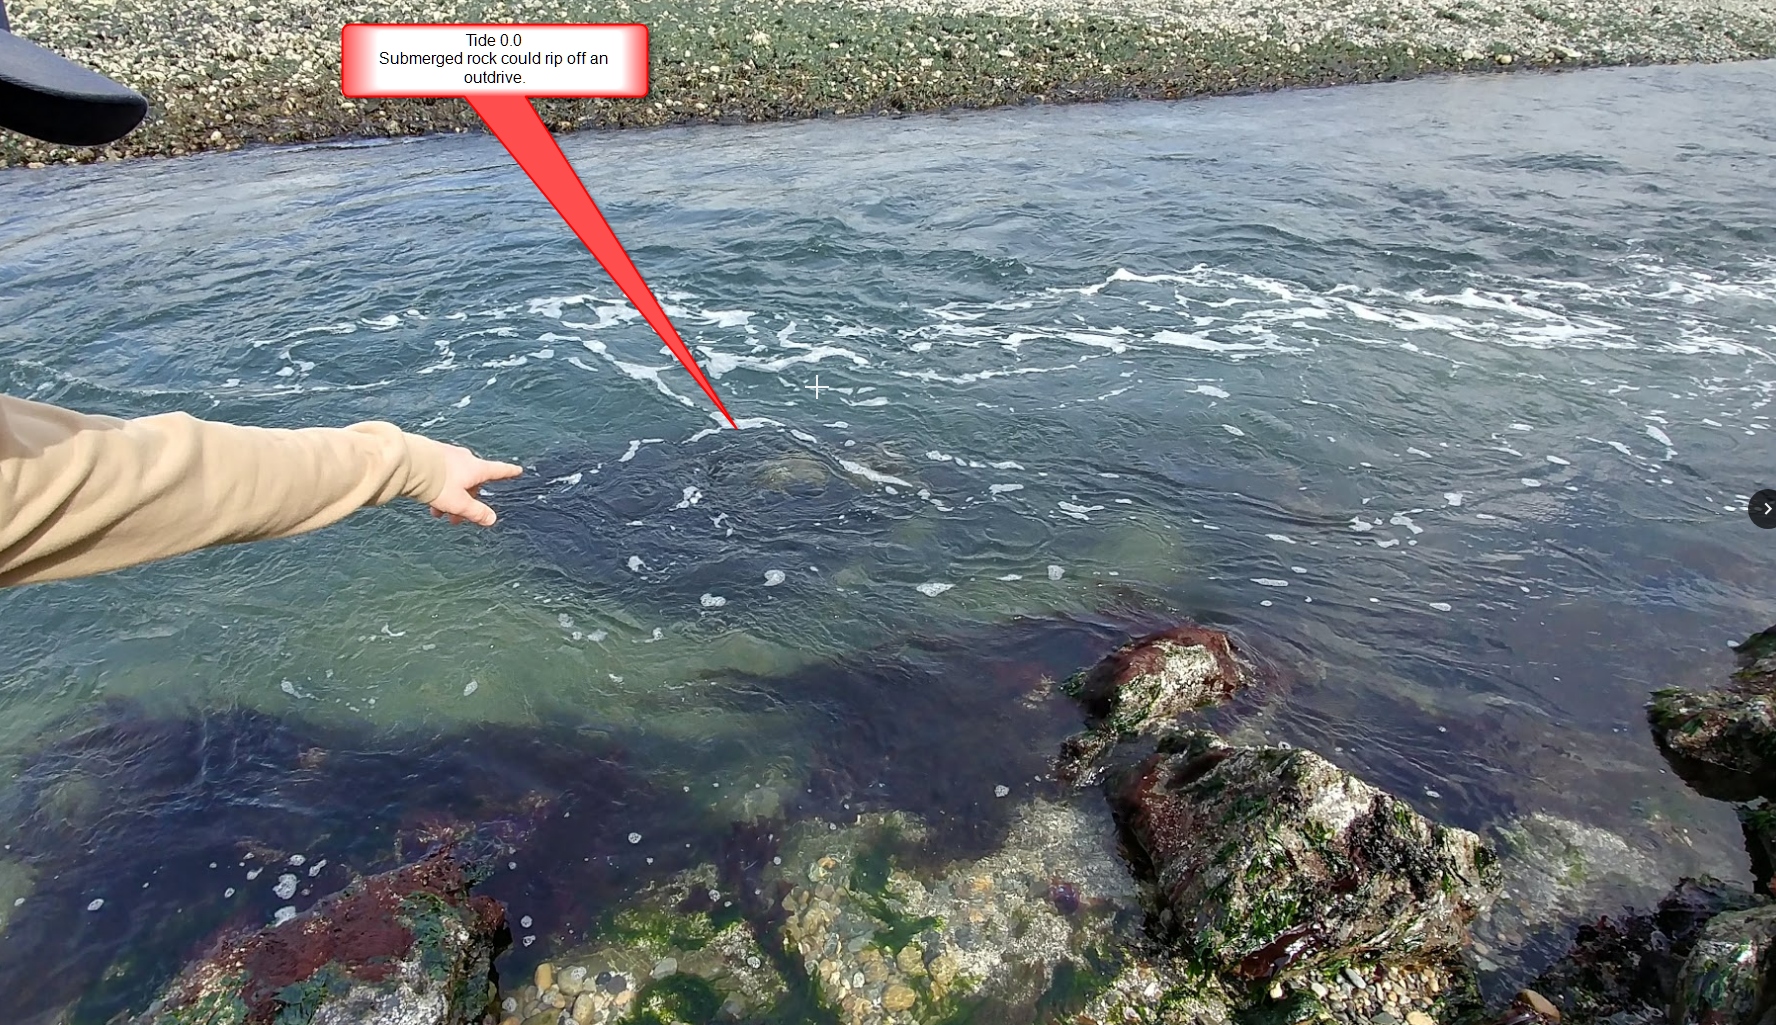
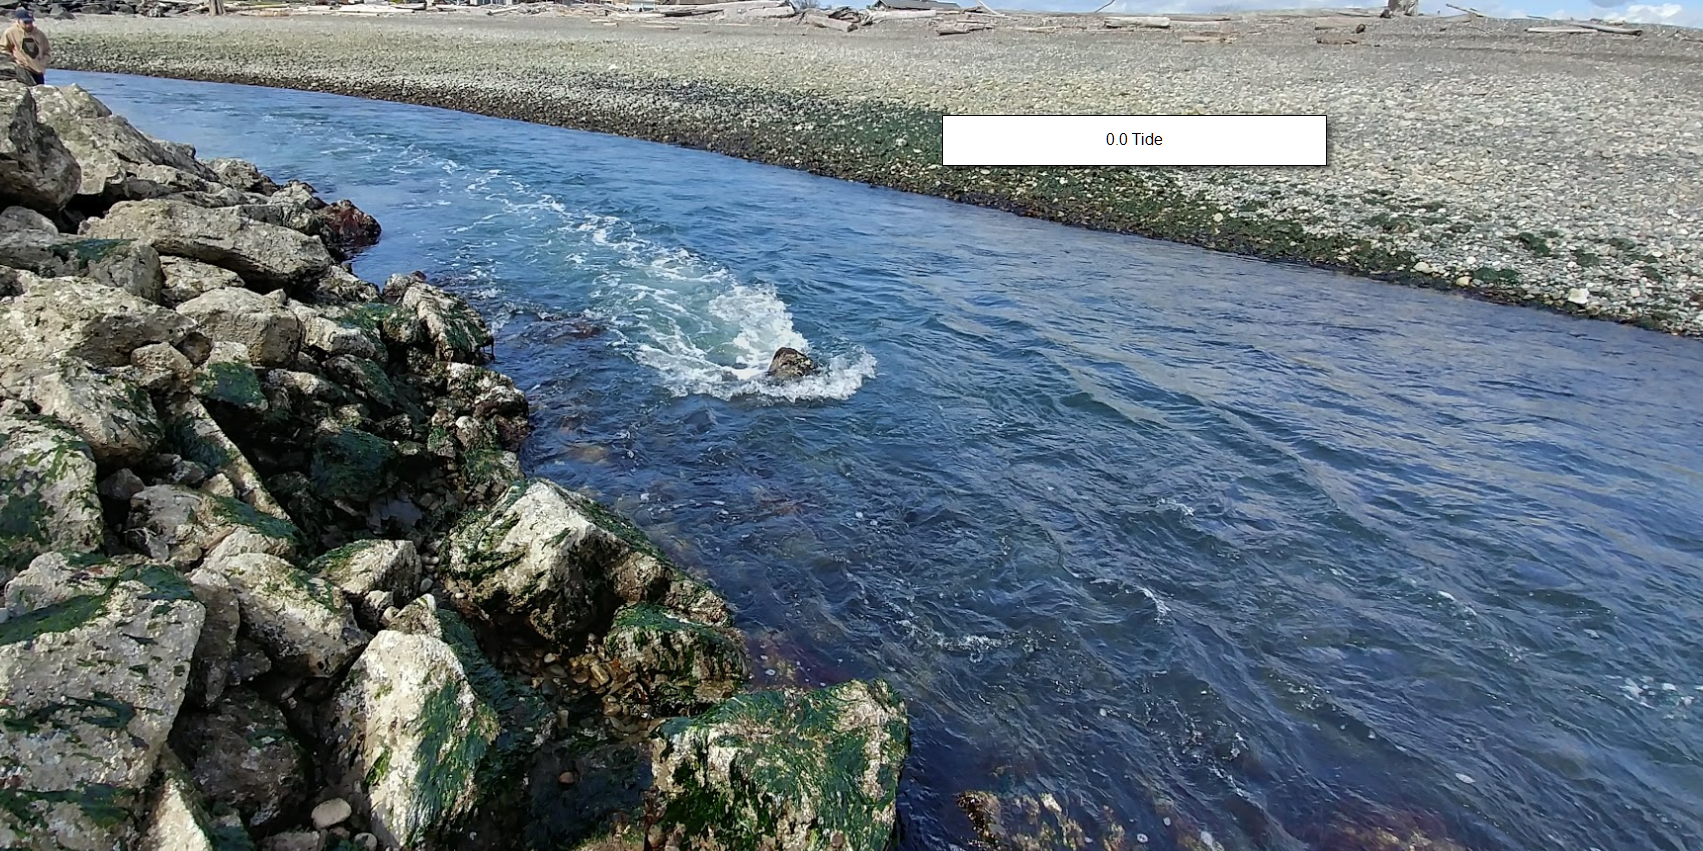
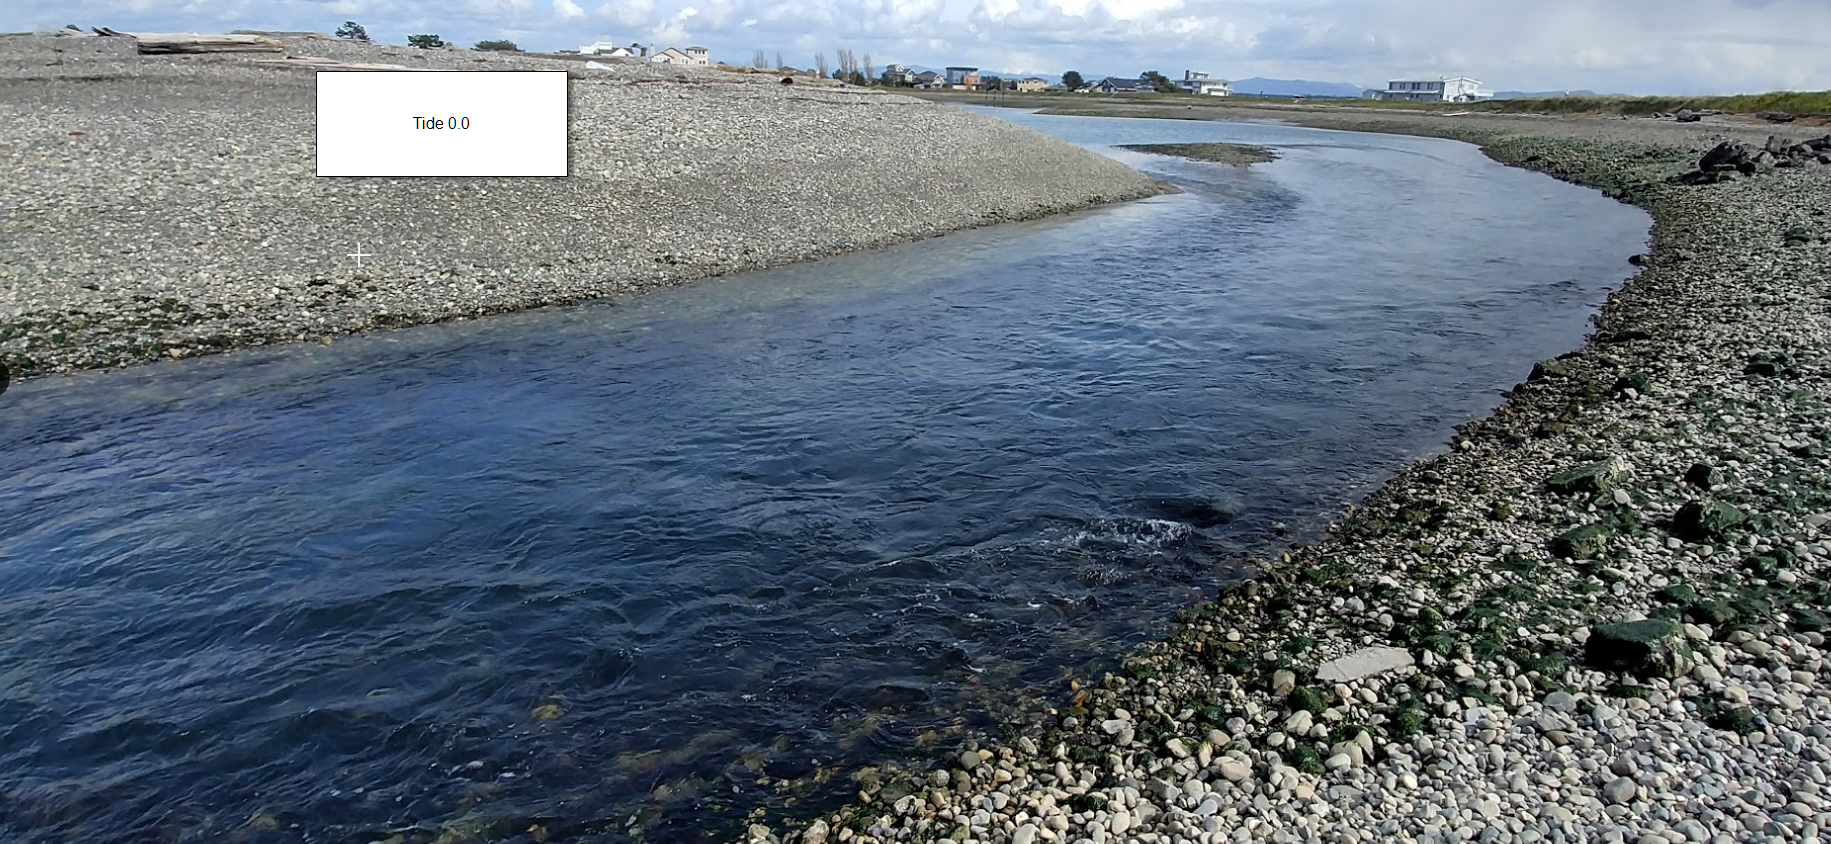
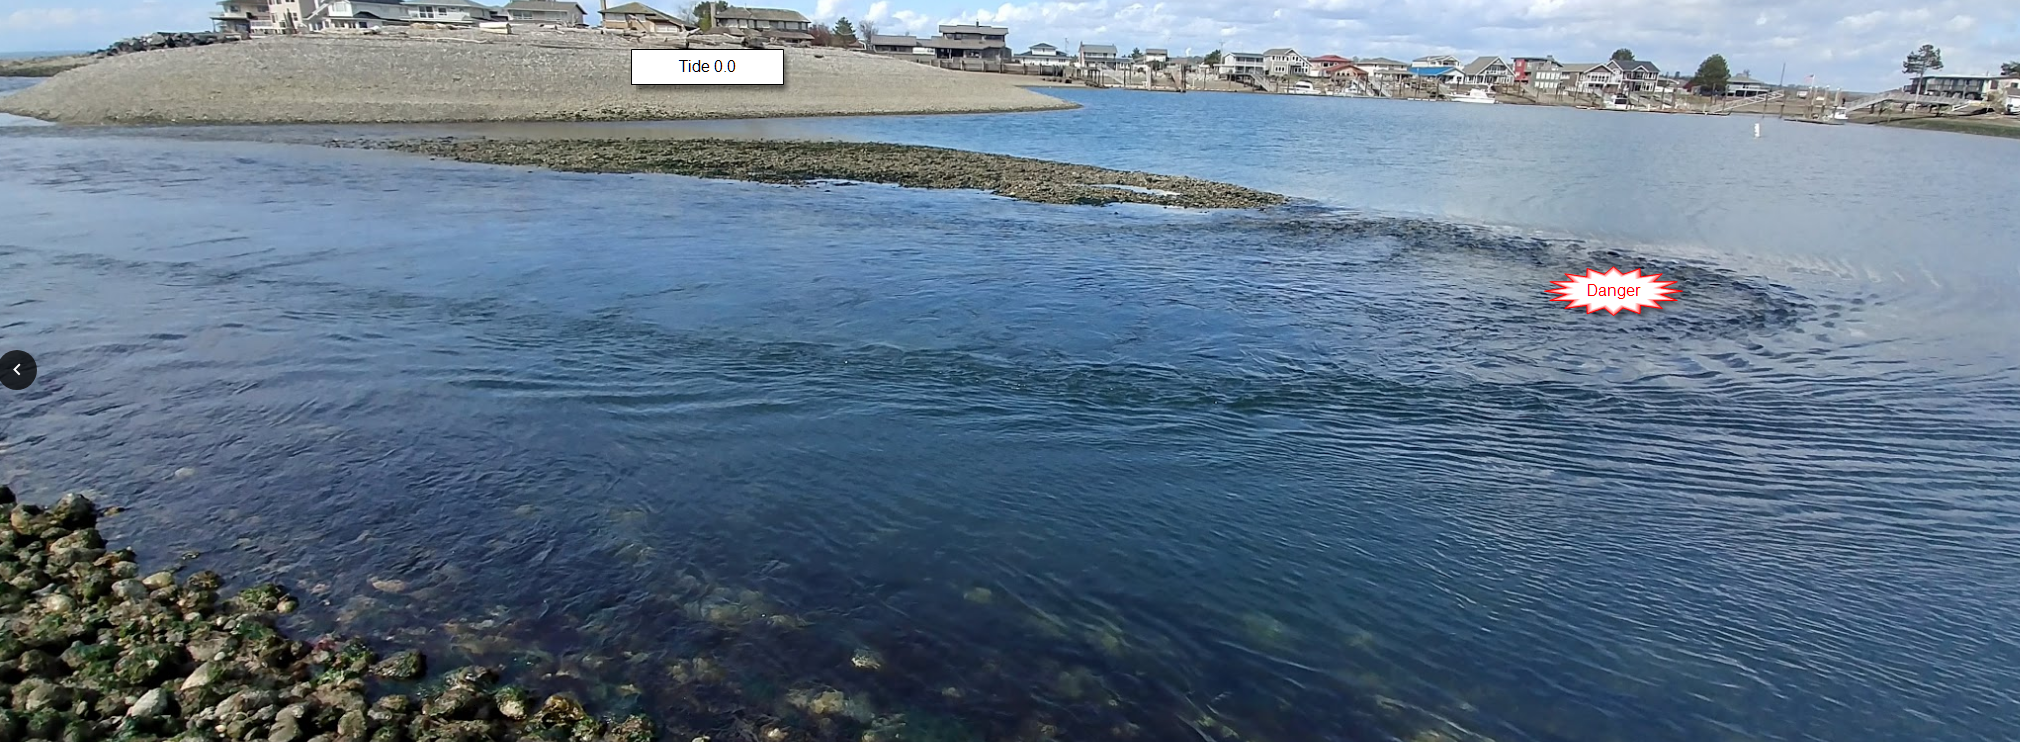
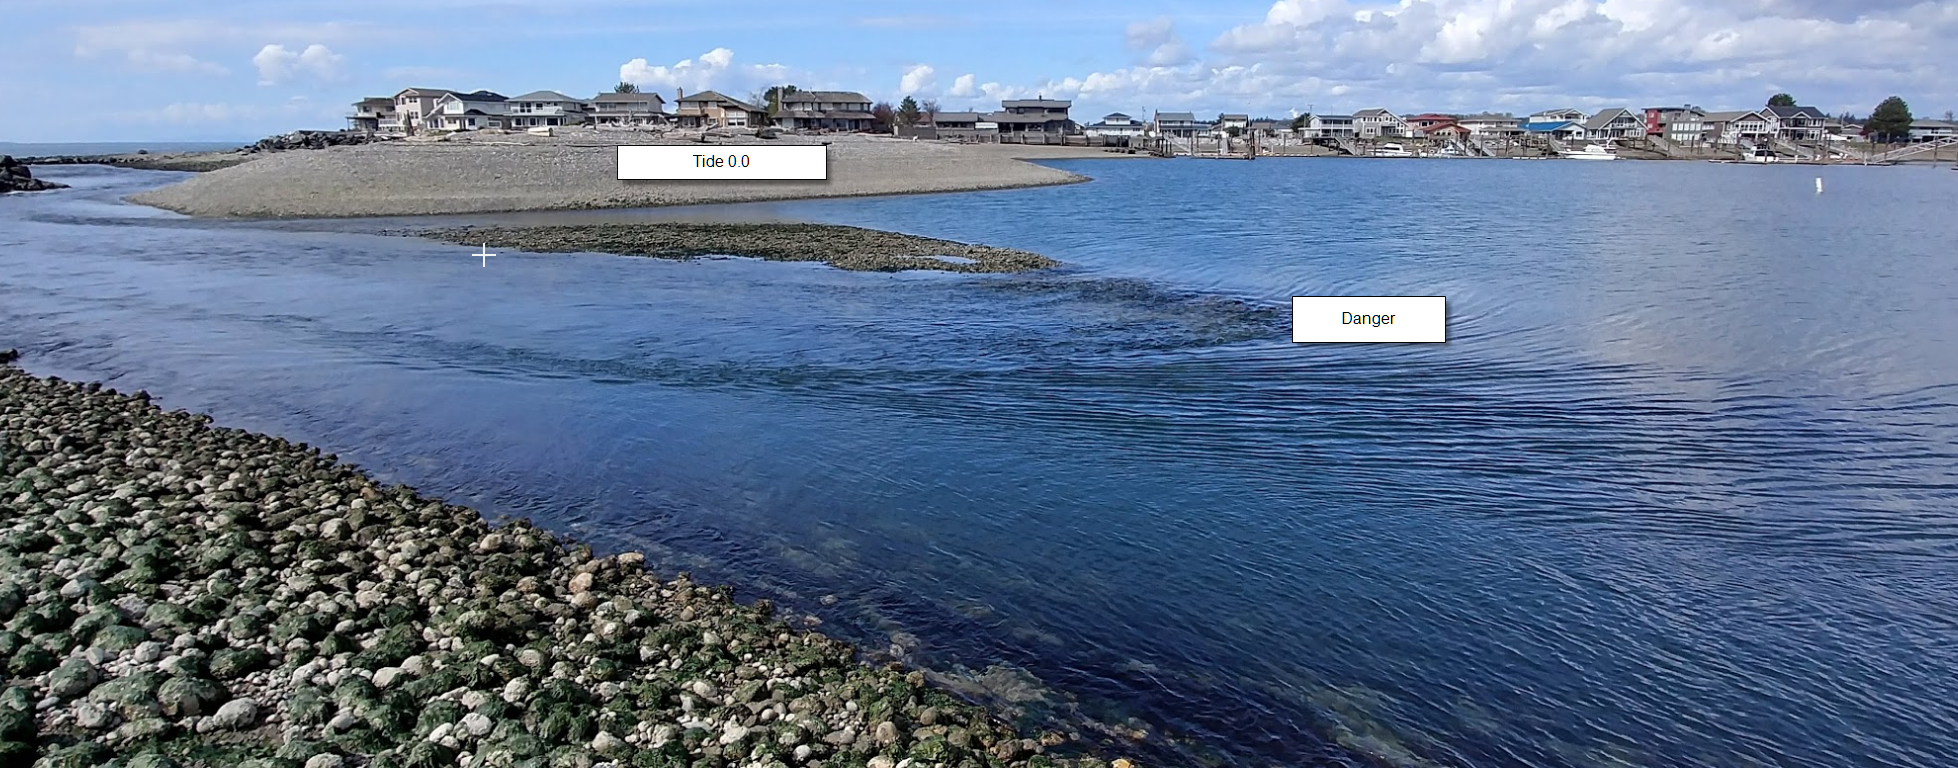
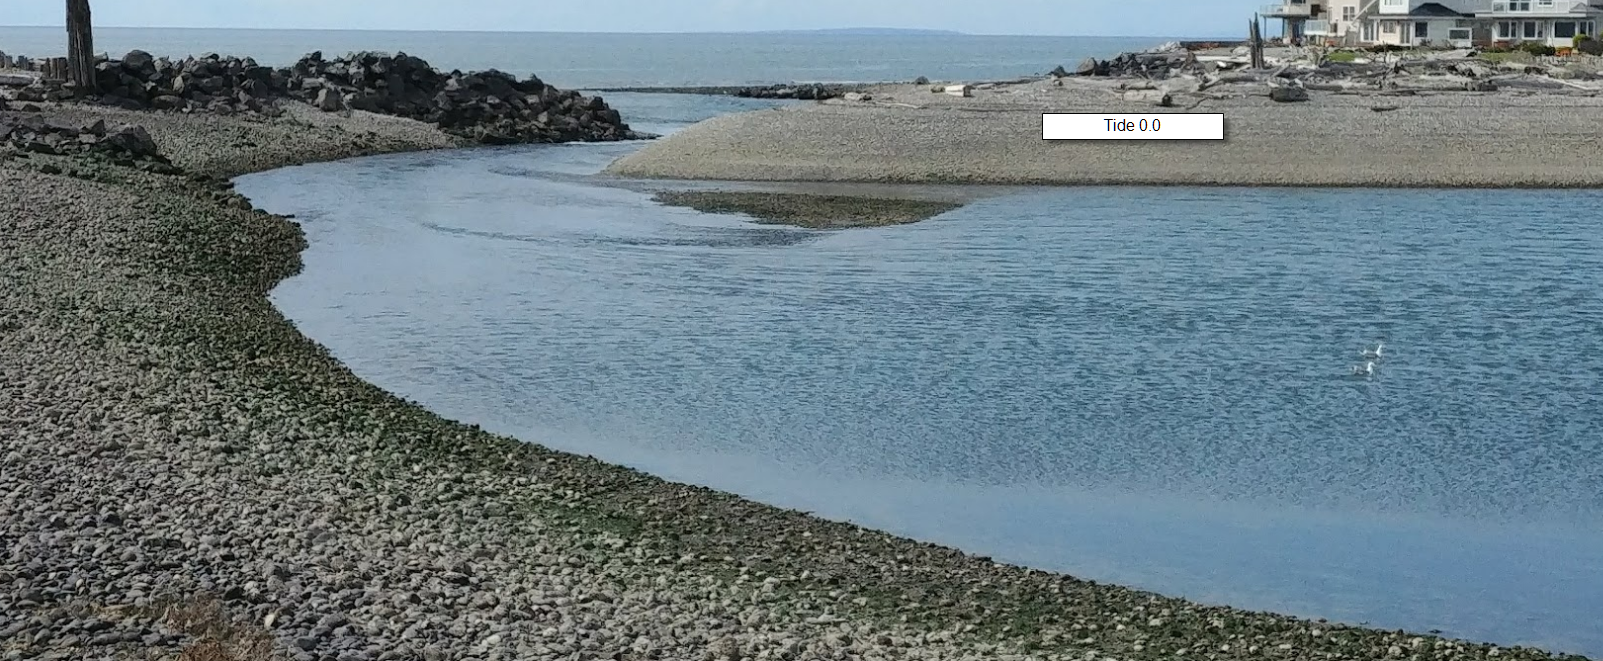
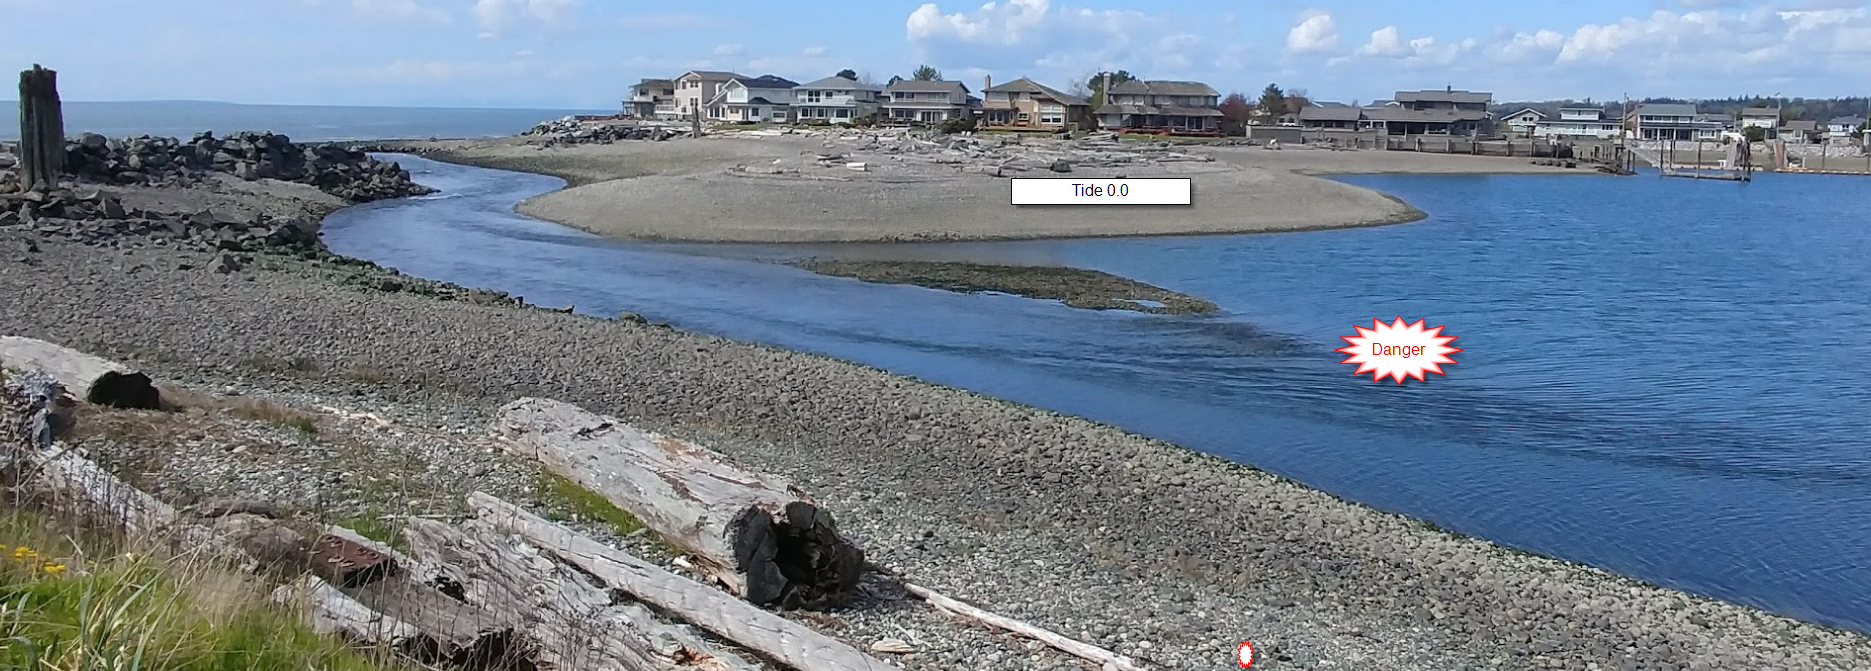
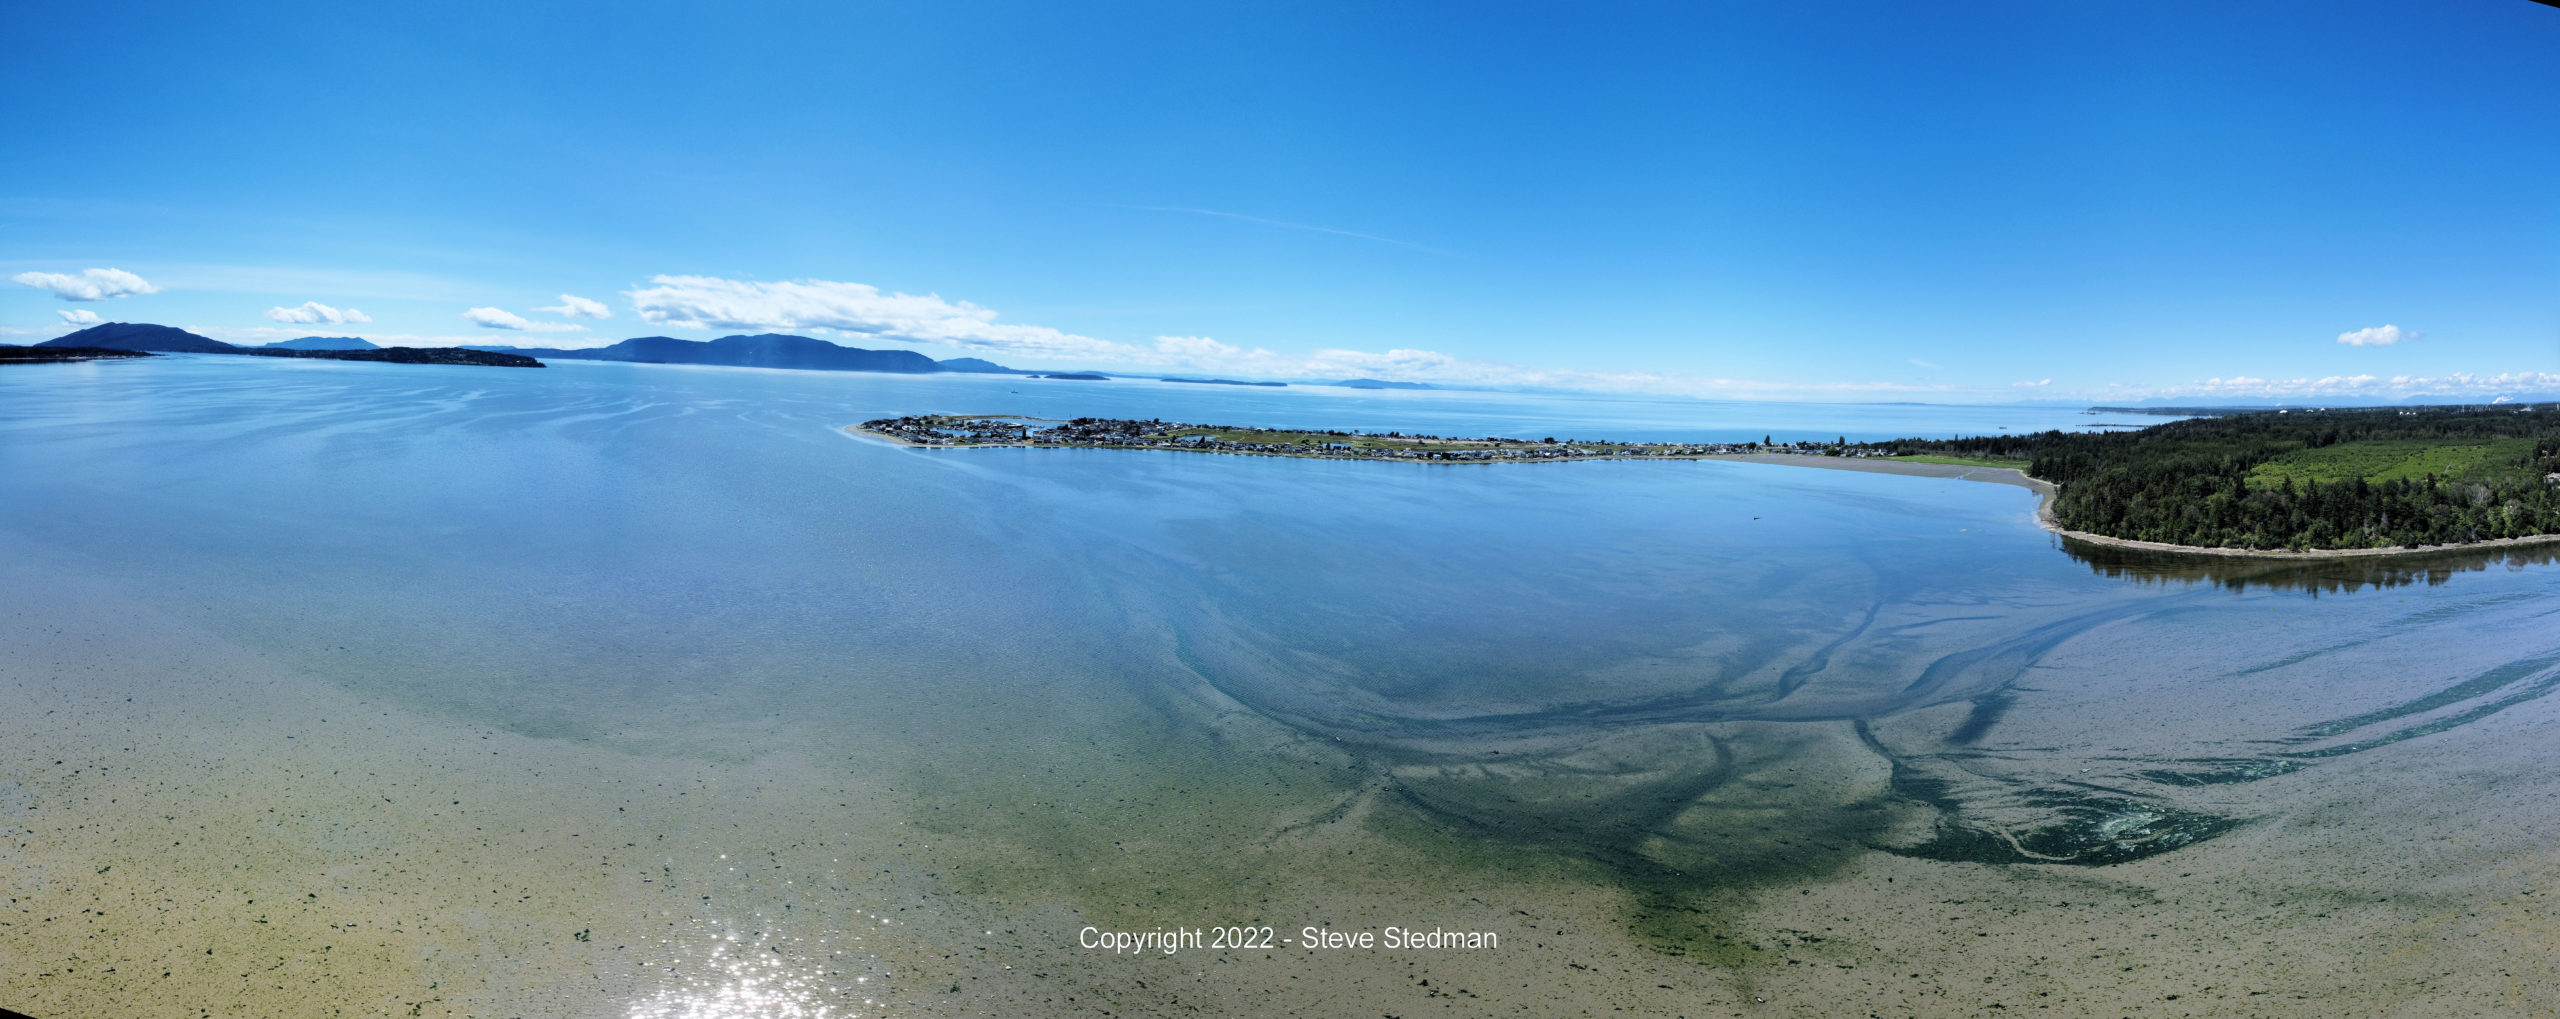
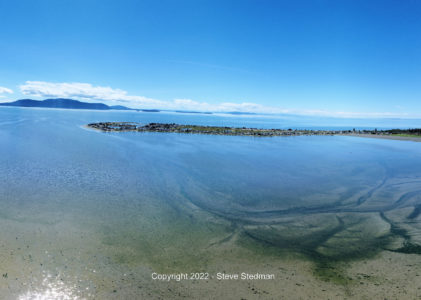
Here are some photos showing the marina entrance at about a 0.0 tide. These photos were taken on April 21st 2018.
BEWARE: things move, the sandbar area changes from year to year, or even from storm to storm.
Click any picture to enlarge.